Business Intelligence

Welcome to my collection of articles on business intelligence.

In today’s data-driven world, Business Intelligence has emerged as a crucial discipline for organizations seeking to gain a competitive edge. I’m passionate about empowering businesses with valuable insights and helping them harness the true power of their data.

The following artciles on Business Intelligence are a comprehensive resource center where you’ll find a wealth of articles that explore the various facets of BI, its applications, and its impact on driving business success.

For business leaders, analysts, and BI professionals, our page offers in-depth knowledge and practical guidance for leveraging BI effectively. Topics covered include data visualization, modeling, analytics, predictive analytics, dashboard design, and more.

We delve into industry best practices, emerging trends, and innovative strategies that can transform your organization’s data into actionable insights. As you navigate through our articles, you’ll gain a deeper understanding of the tools and technologies that power Business Intelligence. We explore popular BI platforms such as Power BI and Tableau, discussing their features, capabilities, and how they can be leveraged to unlock the full potential of your data.

Moreover, we explore the integration of Business Intelligence with other critical systems, such as Customer Relationship Management (CRM) platforms like Salesforce, to enhance data-driven decision-making across your organization.

By aligning BI with Revenue Operations, we help you maximize the value of your data and drive revenue growth. Whether you’re a beginner seeking to grasp the fundamentals of BI or a seasoned professional looking to stay updated with the latest trends, these articles will equip you with the knowledge and insights you need to succeed in the data-driven landscape.

Start exploring our articles and unlock the true potential of your data!

From DAX to SQL: Replicating the Essential Date Table for BI Developers

From DAX to SQL: Replicating the Essential Date Table for BI Developers Having a date table is not optional when it comes to Business Intelligence. When building data models, it’s actually the first table I’m adding most of the time. Why using a date table? As a BI developer, I need to filter different dates…

Details

Learning Python with a Nostalgic Twist: Building the ‘Satellite Game’ from Jak 3

Learning Python with a Nostalgic Twist: Building the ‘Satellite Game’ from Jak 3 This is a non data-related article. However, learning Python might be helpful to master for future data projects, especially when it comes to Data Science. Python has great data related libraries such as Pandas, Seaborn and Matplotlib. They can be used in…

Details

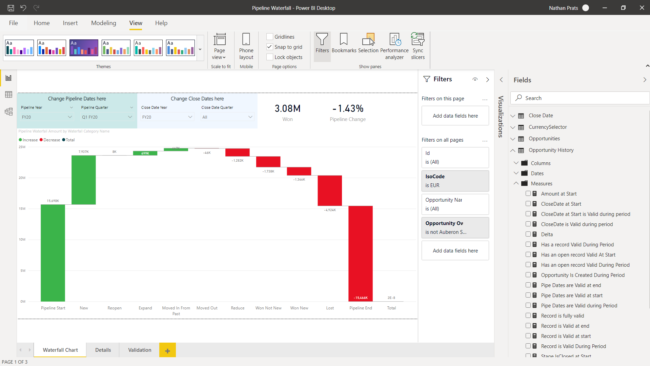
Building a Powerful Pipeline Waterfall Dashboard with Power BI: Unleashing Insights and Customization

Building a Powerful Pipeline Waterfall Dashboard with Power BI: Unleashing Insights and Customization The pipeline waterfall report is one of the advanced visuals the sales department can benefit from. Sales Operations often get access to this analysis through third-party forecasting software companies. However, it’s not uncommon to have data issues with this visual. In another…

Details

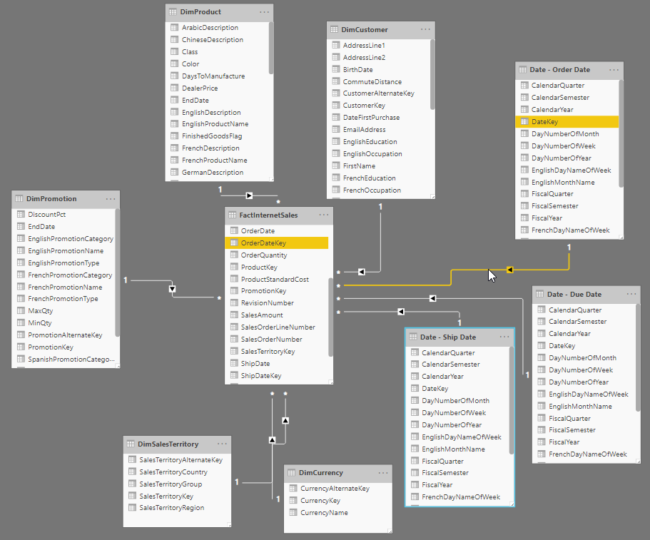
Choosing Between Single Date Table and Multiple Date Tables: A Guide for Data Modelers

As a data modeler, you need to understand the “one or many date tables” dilemma. You don’t want having to switch from one option to another after a few weeks of development, as it’d be a painful change to go through. In this post, I’ll try to give you a clear overview of these two…

Details

Building Effective Hierarchy Structures in Power BI

Building Effective Hierarchy Structures in Power BI Organizational hierarchy or account mapping adds complexity to reporting. Being able to work with it with basic reporting tools like Salesforce report is impossible. For example, if your company sells to big customers with hundreds of subsidiaries, chances are that account mapping is quite important for your selling…

Details

Forecasting Sales Run Rate: Leveraging Historical Performance for Accurate SaaS Projections

Forecasting Sales Run Rate: Leveraging Historical Performance for Accurate SaaS Projections A run rate is a forecast based on current performance. For SaaS companies, this metric is interesting to compute as their future performance is highly influenced by the actual ARR of the company. For example, if a company sells yearly subscriptions, the sales “seasonality”…

Details

4 different ways to dynamically change table’s rows with Power BI

Users often need to see the data in different angles to find the business insights they’re looking for. Instead of creating dozens of visuals in your reports, solutions exist to reduce the number of visuals while giving users control over it. In this post, I’ll detail 4 different ways to achieve this, and I’ll discuss…

Details

Applying the Pareto Principle: Categorizing Products for Sales Analysis in Power BI

Applying the Pareto Principle: Categorizing Products for Sales Analysis in Power BI The Pareto principle says that about 80% of the effects come from 20% of the causes. In this article, I’ll create a Power BI measure to rank products from Adventure Works into 4 categories, to show that a few products represent most of…

Details

A Beginner’s Guide to Business Intelligence: Access, Clean, Organize, and Present Data with Power BI

A Beginner’s Guide to Business Intelligence: Access, Clean, Organize, and Present Data with Power BI Getting started with business intelligence is easy. In this post, I’ll share a few steps to follow to get access to data, start building a data model and create a report in a client application like Power BI. To do…

Details

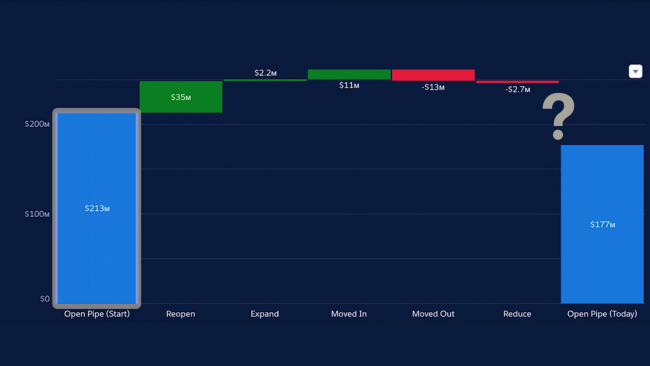
When the Waterfall just doesn’t line up right

When the Waterfall just doesn’t line up right Pipeline waterfall charts are great to analyze your pipeline. Recently, Salesforce launched Einstein Analytics, and it comes with these amazing charts. However, some Salesforce Orgs will face some “bugs” with these charts. Bars on these charts won’t even out, and the following equation can be false: Open…

Details